
PulseBoard
A personal health trigger logging and tracking app that helps users identify patterns in their wellbeing through data analytics.
Hire Me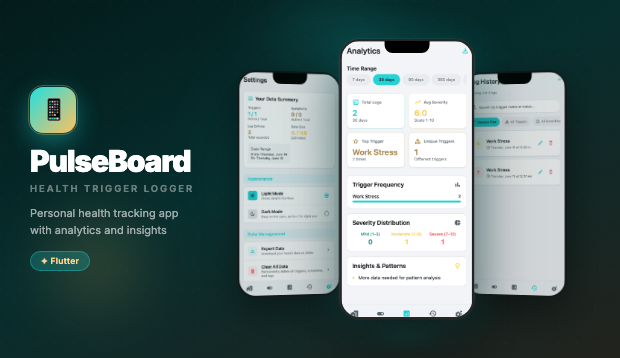
A personal health trigger logging and tracking app that helps users identify patterns in their wellbeing through data analytics.
Project Overview
PulseBoard is a comprehensive health tracking application designed to help users monitor and understand their personal health triggers. The app provides an intuitive interface for logging health events, rating their severity, and discovering meaningful patterns over time.
The application features a clean, modern design with powerful analytics capabilities that transform raw health data into actionable insights. Users can track trigger frequency, analyze severity distributions, and identify trends that might otherwise go unnoticed.
Built with Flutter, PulseBoard ensures consistent performance and user experience across both iOS and Android platforms, making health tracking accessible and engaging for daily use.
The Approach & Solution
The development of PulseBoard centered around creating a non-intimidating interface for sensitive health data entry. The challenge was to make consistent logging feel effortless while providing robust analytical capabilities for pattern recognition.
The visual design strategy employs calming teal and gold accents against clean white backgrounds, creating a medical-professional aesthetic without feeling clinical. Color-coded severity indicators provide immediate visual feedback, while gradient headers add visual interest without overwhelming the content.
The analytics dashboard transforms potentially complex health data into digestible insights through thoughtfully designed cards, progress indicators, and clear categorization. Time-based filtering allows users to examine both short-term patterns and long-term trends in their health triggers.
Flutters rapid development capabilities enabled extensive user testing and iteration on the logging flow, ensuring the app meets the critical requirement of making daily health tracking feel natural rather than burdensome.
The data visualization approach prioritizes clarity over complexity, using simple but effective visual elements that provide immediate insight into health patterns without requiring data analysis expertise from the user.